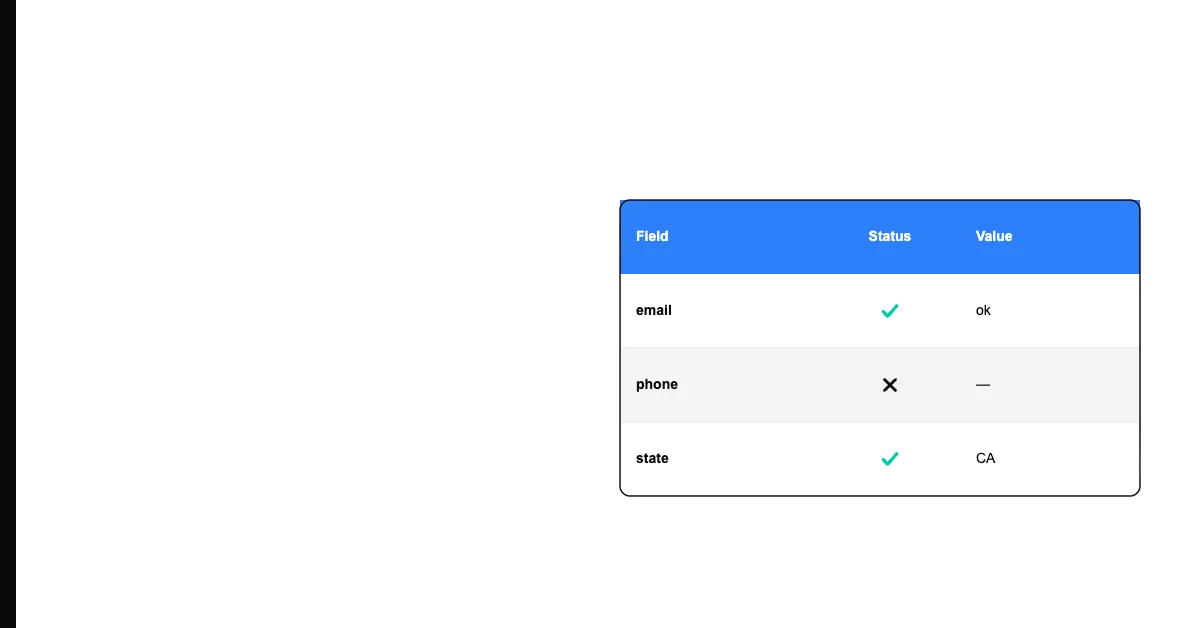
A good data quality score for business-critical data is 95% or higher on completeness and validity, and 99% or higher on uniqueness — though the right threshold depends entirely on how the data is used.
There is no universal standard. A 90% completeness rate might be fine for a historical research dataset and completely unacceptable for a live billing database. The question is not "what score is good" in the abstract — it is "what score is good enough for this specific use case."
How Data Quality Scores Are Calculated
Most data quality scoring frameworks measure each dimension as a percentage:
Completeness score = (rows with the field populated / total rows) x 100
Sohovi profiles every column in your dataset for completeness and flags the exact rows where values are missing — free to try.
Validity score = (rows where the field matches the expected format / total rows) x 100
Uniqueness score = (non-duplicate rows / total rows) x 100
Consistency score = (rows where values are internally consistent / total rows) x 100
An overall data quality score is typically a weighted average of these dimension scores, with weights assigned based on which dimensions matter most for the specific dataset.
Benchmark Thresholds by Use Case
Customer-facing data (email lists, billing addresses, phone numbers) Target: 97-99% completeness and validity. Even a 5% failure rate means thousands of customers receiving wrong or missing communications at scale.
Internal reporting and analytics Target: 95%+ completeness, 99%+ uniqueness. Duplicate records in analytics data produce double-counted metrics that destroy report credibility.
Compliance and regulatory data Target: 99.5%+. Many regulatory frameworks require data to be accurate and complete by definition. Anything below 99% in a compliance dataset is a risk.
Reference and lookup tables Target: 100% validity. These tables drive logic in other systems, so a single invalid value can cascade into widespread errors.
Historical archive data Target: varies. Some historical incompleteness is acceptable and expected. Define a minimum acceptable threshold and flag anything below it.
Why "Good Enough" Is a Business Decision
A 94% completeness score sounds high. But if your dataset has 50,000 records, 6% incomplete means 3,000 unusable records. Whether that is acceptable depends on your use case, not on the percentage.
The right approach is to define the minimum acceptable score for each field before you start measuring, then use your actual scores to determine whether you have a problem worth fixing.
Frequently Asked Questions
Q: Is there an industry standard for data quality scores? There is no single universal standard. DAMA (Data Management Association) and various regulatory frameworks provide guidance, but there is no official "passing score" that applies to all datasets. Industry benchmarks suggest 95-99% as the target range for business-critical data, with higher targets for compliance data.
Q: What data quality score is considered failing? Below 80% on any core dimension for a business-critical field is generally considered a failing score. Between 80-90% is a significant problem. Between 90-95% is acceptable for some use cases but concerning for customer-facing or compliance data. Above 95% is good for most business contexts.
Q: Should every field have the same target score? No. Set targets based on how the field is used. A primary email field used for customer communications should have a higher target than a secondary notes field that is rarely queried. Trying to achieve 99% on every field wastes effort on fields that do not need it.
Q: How do you weight dimensions in an overall data quality score? Weight dimensions by their business impact. For an email marketing list, completeness of the email field might carry 40% of the score, validity of email format 30%, uniqueness 20%, and other dimensions 10%. There is no standard weighting — it should reflect what matters most for that specific dataset.
Q: What does a 95% data quality score actually mean in practice? It means 5% of your records have at least one quality issue. On a 10,000-record dataset, that is 500 records. Whether 500 problematic records is acceptable depends on what you are doing with them. For a sales outreach list, 500 bad contacts is significant. For a marketing analytics archive, it may not matter.
Q: How do data quality scores compare between companies? Most organizations do not publish their scores, so direct benchmarking is difficult. Studies on CRM data quality consistently find that 20-30% of CRM records have at least one quality issue. A score of 90%+ puts you ahead of the typical unmanaged CRM database.
Q: Should you measure data quality score at the field level or the record level? Both. Field-level scores tell you which dimensions are failing in which fields. Record-level scores tell you what percentage of complete, fully usable records you have. A record with one invalid field may be unusable for its intended purpose even if all other fields are perfect. Track both for a complete picture.
Q: Can a high data quality score still mean bad data? Yes. If your quality rules are poorly defined, a high score can be misleading. If your validity rule for phone numbers accepts any 10-digit string, you will score 100% validity even if half the numbers are incorrect. Quality scores are only as meaningful as the rules they are measured against.
Q: How much does improving your data quality score by 5 percentage points matter? It depends on scale and use case. Moving from 90% to 95% completeness on a 100,000-record customer database means recovering 5,000 usable records. The business value of those 5,000 records — in outreach, in revenue, in accurate reporting — typically far exceeds the cost of improvement.
Q: What is the fastest way to improve a low data quality score? Start with the field that has the most downstream impact and the most recoverable failures. Recoverable failures — missing values that can be filled from another source, duplicates that can be merged, formats that can be standardized — can often be addressed in bulk. Tackle completeness before validity; you cannot validate data that is not there.
A data quality score only means something when it is measured against a defined standard for a specific purpose. The businesses that get the most value from data quality scoring are the ones who define their own thresholds before they measure — not after.
If you are not sure where your data stands today, Sohovi gives you an instant completeness, uniqueness, and validity breakdown for every column in your dataset — no database access required, no data leaving your machine.