The first step to improving data quality is measurement: profile your most important dataset across completeness, uniqueness, and validity to establish a baseline score, so that every subsequent decision about what to fix is based on evidence rather than assumption.
Almost every data quality improvement effort fails or stalls because it started with action instead of measurement. Teams delete records, fix formats, or rebuild processes based on what they think is wrong — then discover the actual problems were different, the improvements cannot be quantified, or the fixes addressed symptoms rather than root causes.
Measurement first changes this. When you know your completeness rate is 91% and your uniqueness rate is 94%, you have a prioritized starting point. You know which problem is bigger, which fields are affected, and how much improvement is realistic.
Sohovi profiles every column in your dataset for completeness and flags the exact rows where values are missing — free to try.
Why Measurement Is Step One, Not Step Two
You might think the first step is "identify what is wrong." Measurement is how you do that. Without profiling the data, "what is wrong" is based on impressions — what someone noticed, what recently caused a problem, what seems like it might be an issue.
Profiling produces facts: "Field X is 78% complete. Field Y has 6.4% duplicates. Field Z has 11% of values in invalid format." Those facts determine the priority order of everything that follows.
How to Profile Your Dataset as Step One
Choose your dataset. Pick the single most important dataset in your organization — the one that would cause the most harm if it were wrong, incomplete, or unreliable.
Export it. You need a flat file you can analyze. A CSV export from your CRM, your database, or your marketing platform is sufficient.
Sohovi finds gaps, duplicates, and format errors in your CRM data — so your team is working from records they can trust.
Run a completeness check on each field. Count the non-null values divided by total rows. Any field below 95% for a critical field is a finding.
Run a uniqueness check on your primary identifier. Email, customer ID, order number — whatever uniquely identifies a record. Count duplicates.
Run a validity check on structured fields. Email format, phone number format, date format. Count values that fail the format check.
Sohovi lets you set up validation rules for any column and instantly see which rows fall outside them — no code or SQL required.
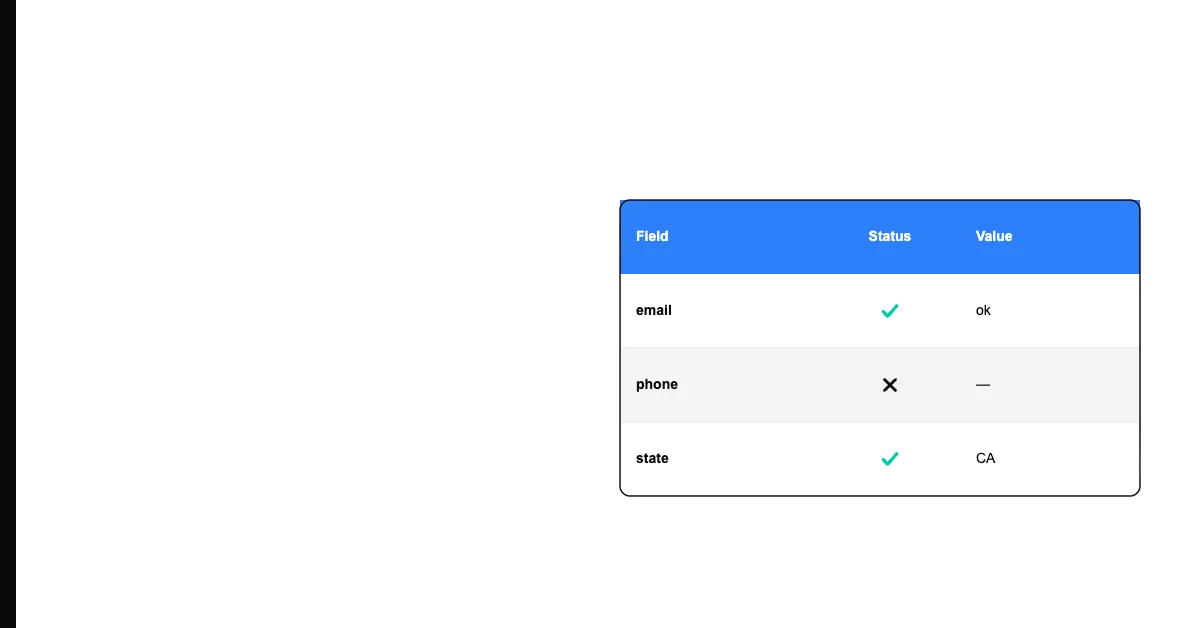
Record the results. A simple table with field name, dimension, score, and failing record count is enough for a baseline.
What Happens After the Baseline
With a baseline in hand:
-
Prioritize — Which finding affects the most records in the most critical fields?
-
Investigate root cause — Why is the field 78% complete? What process produces blank values?
-
Fix the source process — Close the gap that lets bad data in.
-
Clean the existing data — Address the accumulated problems in historical records.
-
Re-measure — After fixes, re-profile to confirm improvement and establish the new baseline.
-
Monitor — Schedule regular checks to track whether quality is stable.
The measurement in step one is not a one-time event. It is the start of a measurement cycle that repeats every check period.
Frequently Asked Questions
Q: What if I do not know which dataset to start with? Start with the dataset that drives your highest-value business process — the one that, if it were wrong, would cause the most visible harm. For most businesses, that is the primary customer contact database, the CRM pipeline, or the billing records. Pick one and start.
Q: How do I get buy-in to start a data quality improvement program? Show the measurement results to decision-makers. Numbers are more persuasive than descriptions. "Our CRM is 82% complete on the email field, meaning 18% of contacts cannot be reached by email" is a concrete business impact statement that justifies investment in improvement.
Q: What should I do if the measurement reveals problems that are too big to fix? Prioritize ruthlessly. You do not have to fix everything — you have to fix the problems that matter most first. A dataset with ten quality problems can still be used if the five problems that affect the highest-priority use case are addressed. Tackle critical findings first and treat the rest as a documented backlog.
Q: Do I need a data quality tool to take the first step? No. As described above, basic profiling can be done in a spreadsheet. What you need for step one is a CSV export of your dataset, 30-60 minutes, and the five formulas described in the manual measurement guide. A tool makes it faster, but it is not a prerequisite for getting started.
Q: How long should the first measurement step take? For a single dataset with 10-20 key fields: 30-60 minutes manually, or under 5 minutes with a profiling tool. Do not let the measurement step become a multi-week project. The goal is a baseline — specific enough to prioritize, not so exhaustive it delays action.
Q: What if the people who own the data resist measurement? Frame it as a positive diagnostic, not a performance review. You are measuring the health of a system, not evaluating the competence of individuals. Start with a dataset where the owner is supportive, build a track record of measurement leading to improvement, and expand from there.
Q: What is the difference between a baseline measurement and a full audit? A baseline measurement produces quality scores (percentages) for key dimensions across key fields. A full audit goes further: it scores severity, investigates root causes, and produces a documented findings report with recommendations. The baseline is step one. The full audit is what you do when you want to act systematically on the findings.
Q: Should the first improvement fix the biggest problem or the easiest problem? In most cases, fix the biggest problem first — the finding that has the most business impact. However, if a quick win is available that is highly visible to stakeholders (removing obvious duplicates, filling in a commonly missing field), it can be worth doing early to build momentum and credibility for the larger improvement program.
Q: How do you make sure data quality improvements stick? Fix the process that produced the problem, not just the data that reflects it. Schedule regular checks so degradation is caught early. Assign ownership so there is someone accountable for maintaining quality. Document your standards so they persist when the people who defined them move on.
Q: What is the most common mistake people make when trying to improve data quality? Starting with action instead of measurement. Teams that begin by cleaning data without profiling it first often find they cleaned the wrong things, cannot prove the improvement, and face the same problems returning within months. Measure first, every time.
Every effective data quality program starts the same way: with a clear picture of where things stand. The rest — prioritization, root cause analysis, remediation, prevention — all flow from that baseline.
If you are ready to take the first step, Sohovi lets you profile your most important dataset in under a minute. Upload your CSV, see your completeness, uniqueness, and validity scores by column, and leave with a prioritized list of what to address first. No code required, no data leaves your browser.