Data Profiling

What to Look for When Profiling Customer Data for the First Time

Profiling a customer dataset for the first time reveals problems you didn't know you had. Here's exactly what to look for and how to prioritize what you find.

How to Profile Your Customer Data for the First Time

You've been handed the company's customer database. It's been in use for four years, fed by three different systems, and no one has ever run a systematic quality check on it. You're about to run your first data profile. Here's what you're going to find — and what to do with it.

Start With the Most Critical Fields

Not all columns are equal. Before you profile everything, identify the fields that matter most for your primary use case:

  • For email marketing: email address (completeness and validity) and first name (for personalization)
  • For sales outreach: phone number (completeness and format) and company name
  • For segmentation: industry, company size, job title — whatever fields you use to target
  • For compliance: consent fields, opt-out flags, data source
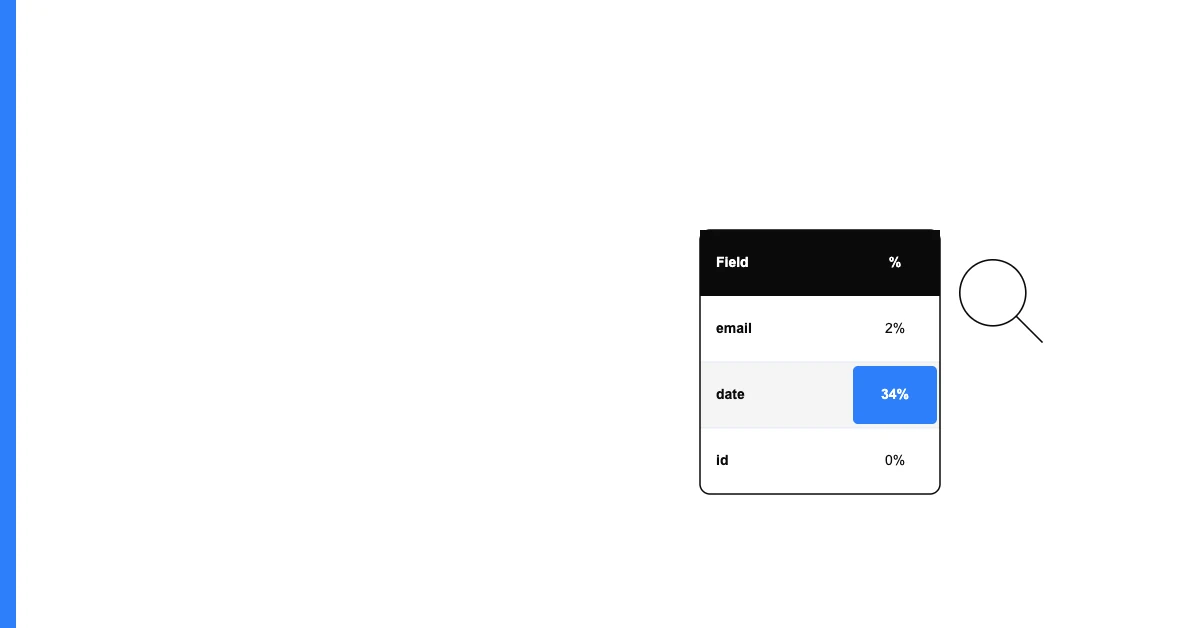
 — these must be reliable

Profile these critical fields first. The rest can wait. Starting with your highest-impact fields means you see actionable findings immediately rather than spending hours profiling columns nobody uses.

What You're Likely to Find

In a customer database that's been actively used for 2+ years with multiple contributing systems, typical findings include:

  • Email completeness: 60–80% (not 100% as you hoped)
  • Duplicate records by email: 10–25% of the database
  • Phone number format inconsistencies: 8–15 different formats in the same column
  • Job title variants: 50+ distinct values where you expected 10–12
  • Missing company information: 15–30% of records with no company name

These are not outliers. They're the norm for any database that grew organically over time without systematic quality management. The question isn't whether you'll find these problems — it's how severe they are.

Running the Profile

In Excel: For each column, create a pivot table to see distinct value counts and top values. Use COUNTBLANK() to measure completeness. Sort to find the range for numeric and date columns. This works for files up to about 50,000 rows.

With Sohovi: Upload your customer CSV and get a complete column-by-column profile in seconds — completeness rates, distinct value counts, top values, format patterns, and PII detection. No formulas to write, no pivot tables to configure.

For very large datasets: Export a representative sample (10,000–20,000 rows) for your initial profile. A sample profile gives you accurate findings at a fraction of the processing time.

Sohovi lets you upload your CSV and get an instant data quality report — no setup, no code required.

Reading the Results: What to Look For

Completeness below 90% in key fields: Any field you rely on for operations or analysis that's below 90% complete is a problem. Below 80% is severe. Below 60% means the field is effectively unusable for anything that requires broad coverage.

Distinct values much higher than expected: A "state" column with 80 distinct values (when you expected 50 US states plus a few Canadian provinces) indicates format inconsistency. "California", "CA", "CALIFORNIA", "Calif." are all the same state but count as 4 distinct values.

Top values that are placeholders: If "N/A", "Unknown", "test@test.com", or "John Doe" appear in your top 10 values, you have systematic placeholder contamination that needs to be removed before the field is reliable.

Min/max values outside expected ranges: Order dates in 1970, ages of 150, zip codes with 8 digits — these outliers indicate systematic entry errors, format conversions gone wrong, or data from a source system that used different conventions.

The Priority Framework for Remediation

After your first profile, categorize findings before you start fixing:

Fix immediately — Problems that directly affect your most frequent use case and are actively causing harm. A 40% bounce rate on email campaigns because of invalid email data is a fix-now problem.

Fix in the next sprint — Problems that create compliance or legal risk. Incomplete consent fields, PII in unexpected columns, or missing data source tracking need attention before your next data processing activity.

Fix this quarter — Problems that affect analytics quality but aren't breaking operations. Inconsistent job titles, missing industry data, or format variations that make reporting less accurate.

Document and monitor — Problems that are too complex to fix right now or where the original data is unavailable. Track these with a target remediation date rather than ignoring them.

After the Profile: Preventing Future Degradation

A clean database stays clean only if you prevent new problems at the entry point. After completing your first profile and remediation:

  • Make key fields required in all data entry forms
  • Add format validation for email, phone, and date fields
  • Set up a monthly re-profile to catch new problems before they accumulate
  • Document the acceptable values for categorical fields (dropdown lists, not free text)

A first data profile is a snapshot. The goal is to use it as the baseline for an ongoing quality program — not a one-time cleanup exercise.

If you're ready to stop guessing about your data quality, Sohovi is built for exactly this. Upload your first CSV free — no credit card, no IT team, no code needed.

Sohovi Team

Data quality, for people who ship

The Sohovi team writes practical guides on data quality, profiling, and governance to help teams ship better data.

Start for free

Stop guessing. Start knowing your data quality.

Sohovi profiles your datasets in minutes — surfacing completeness gaps, type mismatches, and duplicate patterns before they reach production.

No credit card required · Free forever plan