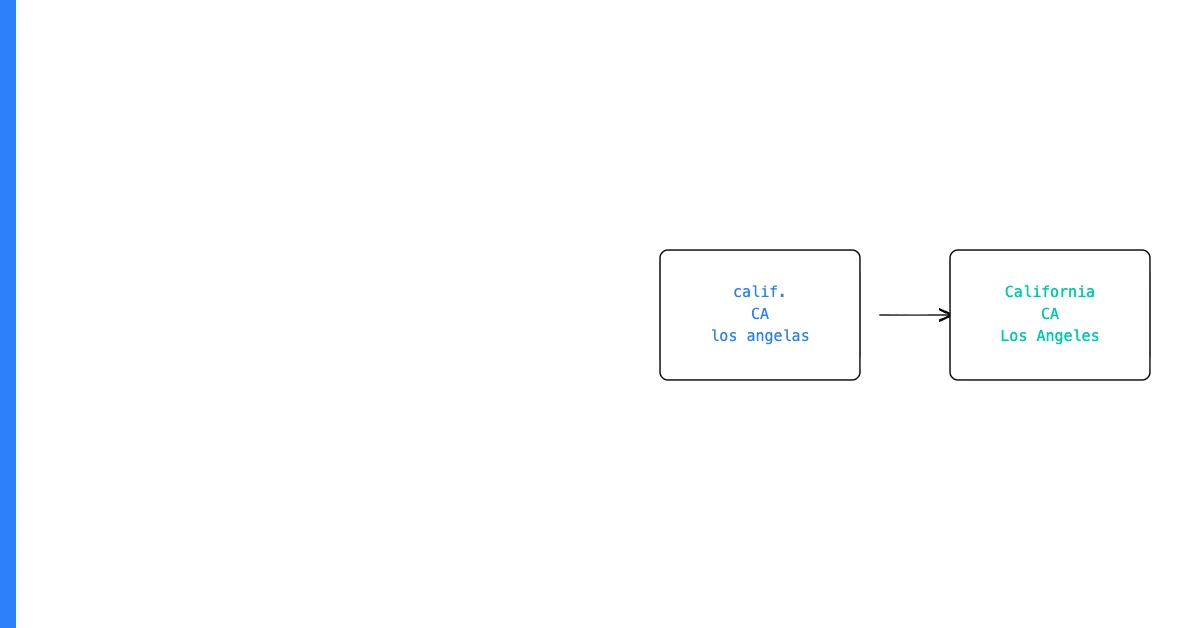
Inconsistent data formats don't announce themselves. They don't produce error messages. They produce reports that look complete and authoritative — but are subtly, silently wrong.
Your "revenue by state" report shows 50% of revenue in "NY" and 30% in "New York" and 20% in "new york." These are the same state. But your reporting tool treats them as three different groups. You just attributed every dollar to the wrong state or split it into incomparable categories.
This is the invisible cost of inconsistent data formats.
Sohovi gives you the data quality picture you need to make the case for fixing it — and to track improvement over time.
The Most Common Format Inconsistencies That Break Reports
Categorical Field Fragmentation
When a categorical field like "state," "status," "industry," or "product category" has multiple representations of the same value, any report that groups or filters by that field is wrong.
"Active" and "active" and "ACTIVE" create three groups in a pivot table. A segment filter for "Active" misses 66% of active records. A trend report shows different "Active" counts by month not because activity changed — but because different users entered the value differently in different months.
Date Format Inconsistencies
A revenue trend report that sorts by date produces wrong ordering when some dates are in MM/DD/YYYY format and others are in YYYY-MM-DD format. Text sorts alphabetically, not chronologically — "1/15/2024" comes before "3/5/2024" alphabetically but not chronologically.
Sohovi tracks quality trends across runs and alerts you when a metric — null rate, duplicate count, score — moves outside its normal range.
A cohort analysis that groups customers by join month breaks when some join_date values are stored as dates and others as strings. The date-typed values group by month correctly; the string-typed values don't group at all.
Numeric Format Inconsistencies
A revenue column with some values as "$1,234.56" (string with currency symbol and comma) and others as "1234.56" (plain number) can't be summed. Excel may silently ignore the string values, producing a subtotal that appears valid but is missing a significant portion of the data.
Cross-System ID Mismatches
A customer_id of "CUS123" in your CRM and "CUS_123" in your billing system (with an underscore) means that a join between these two systems on customer_id produces zero matches — despite representing the same customers.
Sohovi finds gaps, duplicates, and format errors in your CRM data — so your team is working from records they can trust.
How to Find Format Inconsistencies in Your Reports
Run a distinct-value analysis on every categorical field. Before trusting any report that groups by a categorical field, look at every distinct value in that field. If you see "NY" and "New York" and "new york" in the same column, your report is fragmented.
Compare group sizes to expectations. If you know you have about 1,000 active customers but your report shows 340 "Active," 320 "active," and 340 "ACTIVE," you've just found a format inconsistency.
Test cross-system joins before building reports. Before a report that joins two systems on a shared key, check that the join produces the expected number of matched records. A lower-than-expected match rate usually indicates a key format mismatch.
Check date field types in your reporting tool. If a date field is showing unexpected sort order, check whether the values are stored as dates or as text strings.
The Fix: Standardize Before You Report
The fix for format inconsistencies is standardization — applied either at the source (preventing them from entering) or before reporting (normalizing them as part of the reporting query or view).
For recurring reports, standardize at the source to fix the problem permanently. For one-time analyses, standardization in the query is faster.
Quick standardization approaches:
- Categorical fields: UPPER()/LOWER() + TRIM() + CASE statement to canonical values
- Date fields: CAST(date_field AS DATE) or TO_DATE() to convert strings to proper dates
- Numeric fields: REPLACE('$','') + REPLACE(',','') + CAST AS DECIMAL
- ID fields: REPLACE('_','') or LOWER() to normalize case and separator inconsistencies
Frequently Asked Questions
Q: How do inconsistent data formats affect business reports? They fragment metrics into multiple incomplete groups. A status field with "Active," "active," and "ACTIVE" produces three groups in any report that aggregates by status — understating each group and making the total misleading. Every filter, segment, and trend analysis that touches a field with format inconsistencies produces wrong results.
Q: Why do format inconsistencies often go unnoticed in reports? Because the reports look complete. All the numbers sum to something plausible; there are no error messages or missing values. The fragmentation is only visible if you know the actual number of values each group should contain, or if you explicitly look for duplicate categorical groups in your output.
Q: What is the fastest way to identify format inconsistencies in a dataset?
A distinct-value count on each categorical field immediately reveals how many representations of the same value exist. In SQL: SELECT field, COUNT(*) FROM table GROUP BY field ORDER BY field. In a spreadsheet: a pivot table on the categorical column shows every distinct value with its count.
Q: Do format inconsistencies affect machine learning models and predictive analytics? Yes. If categorical features fed to a model have format inconsistencies, the model treats "Active" and "active" as two different categories. This adds noise to the training data, reduces model accuracy, and makes feature importance analysis meaningless for affected fields.
Q: How do I fix format inconsistencies in a large database without disrupting operations? Fix in layers. First, create standardized views or derived columns that normalize the values without altering the source. Update reports to use the standardized version. Then, once reports are validated, apply the normalization to the source data and remove the intermediate layer.
Q: What's the relationship between data standardization and report governance? Report governance requires that data driving official reports meets defined quality standards. Format inconsistencies violate those standards. Strong report governance includes a step that validates the format consistency of underlying data before any report is published or presented.
Q: How do I prevent format inconsistencies from returning after I fix them? Enforce controlled vocabularies (dropdown menus instead of free-text entry), add validation rules at import, and run periodic format consistency checks as part of your data quality monitoring. The best long-term fix is preventing inconsistencies from entering, not repeatedly cleaning them up.
Q: Can BI tools (Tableau, Power BI, Looker) handle format inconsistencies automatically? Some tools have calculated fields that can apply normalization (case functions, TRIM, REPLACE). But relying on the BI layer to fix format inconsistencies is a fragile approach — the fix needs to be maintained in the BI tool, doesn't propagate to the source data, and may be missed when new reports are built against the same data.
Q: How do I communicate data format inconsistencies to business stakeholders? Show the impact concretely: "Our 'revenue by status' report currently shows $X million as 'Active' and $Y million as 'active.' These are the same status — the total is actually $X+Y. I've found a fix that will consolidate these groups in future reports." Business stakeholders respond to dollar amounts and visible impacts, not to abstract data quality concepts.
Q: What is the most impactful format inconsistency to fix first? The field with the most variants that's used in the most reports and the most business decisions. For most businesses, this is a status or stage field in their CRM — it drives pipeline reporting, customer health reporting, and conversion rate analysis. Standardizing it immediately improves the most reports with the least effort.
Format inconsistencies are the silent tax on every report your team produces. Find them with a distinct-value count. Fix them with standardization. Prevent them with validation at entry. Do these three things and your reports will be immediately more trustworthy.
If you want to run a fast distinct-value analysis on your most important categorical fields, Sohovi shows you the complete value distribution for every column in your dataset — instantly, for free, with your data never leaving your browser.