Collibra's Adaptive Rules and Sohovi's Behavioral Scoring both use statistical baselines and z-scores to detect data anomalies automatically. The difference is scale, cost, and who they're designed for.
Collibra is the market-leading enterprise data governance and quality platform. Its Adaptive Rule feature (part of Collibra DQ & Observability) has become one of its most distinctive capabilities. But Collibra's pricing starts in the tens of thousands of dollars annually, making it inaccessible for small businesses, freelancers, and early-stage teams.
Sohovi is built as a lightweight alternative — privacy-first, browser-based, and designed for small businesses who need professional-grade data quality without enterprise pricing.
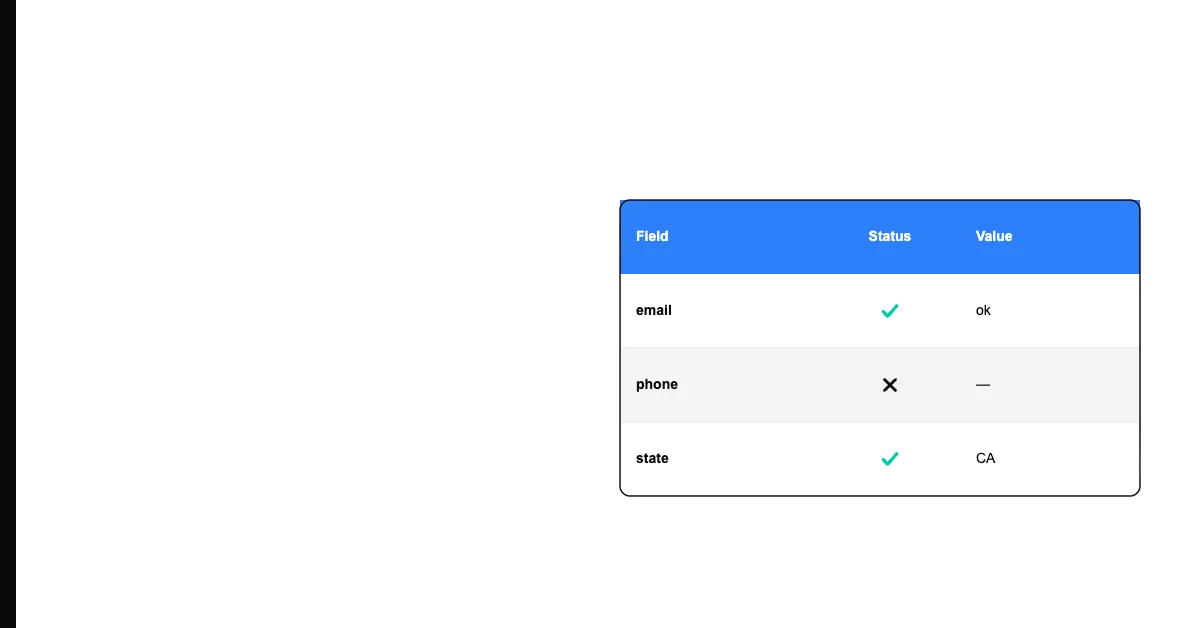
Sohovi automatically detects PII in your datasets — emails, phone numbers, SSNs — all processed client-side so your data never leaves the browser.
How Collibra Adaptive Rules Work
Collibra's Adaptive Rules (called the "Behavior" system internally) work as follows:
- When a dataset is first connected, Collibra profiles it and builds a model of what "normal" looks like.
- Over time, Collibra monitors nine key data characteristics: null values, empty values, cardinality, data type shifts, row counts, load time, minimum values, maximum values, and mean values.
- After each new run, Collibra compares the current statistics against the learned baseline using z-scores.
- Deviations beyond the threshold generate adaptive rule violations — automatically, with no manual SQL writing.
- Collibra produces a separate "Behavior Score" alongside the traditional DQ score.
The model continuously refines itself as data changes, so it adapts to legitimate long-term trends while still flagging sudden anomalies.
Sohovi tracks quality trends across runs and alerts you when a metric — null rate, duplicate count, score — moves outside its normal range.
How Sohovi Behavioral Scoring Works
Sohovi's Behavioral Scoring implements the same core algorithm:
- After each DQ run, column-level statistics are stored: null rate, unique rate, avg value, std deviation, min/max, inferred type, and top values.
- When a new run completes, the scorer fetches the last 10 runs' statistics and computes z-scores for each metric per column.
- Deviations beyond 3 sigma are flagged as behavioral anomalies with per-column messages showing the observed value, expected range, and z-score.
- A Behavior Score (0–100) is shown on the run detail page alongside the DQ Score.
Sohovi also includes distribution shift detection: comparing the top value frequencies between the current and previous run to catch new categorical values.
Feature Comparison
| Feature | Collibra Adaptive Rules | Sohovi Behavioral Scoring | |---|---|---| | Statistical baseline learning | ✅ Yes | ✅ Yes | | Z-score anomaly detection | ✅ Yes | ✅ Yes | | Null rate monitoring | ✅ Yes | ✅ Yes | | Cardinality monitoring | ✅ Yes | ✅ Yes | | Mean/min/max monitoring | ✅ Yes | ✅ Yes | | Row count monitoring | ✅ Yes | ✅ Yes | | Data type shift detection | ✅ Yes | ✅ Yes | | Distribution shift detection | ✅ Yes | ✅ Yes | | Load time monitoring | ✅ Yes | ❌ Not applicable (client-side) | | Auto-generated SQL rules | ✅ Yes | ❌ Not SQL-based | | Separate Behavior Score | ✅ Yes | ✅ Yes | | Works with cloud databases | ✅ Yes | ❌ File-based (CSV/Excel/Sheets) | | Raw data stays local | ❌ Data sent to Collibra | ✅ Raw data never leaves browser | | Pricing | Enterprise ($$$$) | Small business ($ or free) | | Setup time | Days–weeks | Minutes | | Required infrastructure | Significant | None |
Where Collibra Has the Advantage
Enterprise data sources. Collibra connects directly to Snowflake, BigQuery, Redshift, SQL Server, and dozens of other enterprise data warehouses. It monitors data in-place. Sohovi processes CSV/Excel files and a handful of connectors — it's not a data warehouse monitoring tool.
Scale. Collibra is designed for petabyte-scale data quality monitoring across hundreds of data assets simultaneously. Sohovi is designed for individual datasets and small teams.
Governance features. Collibra bundles data quality with data catalog, data lineage, business glossary, and stewardship workflows. Sohovi is focused on data quality specifically.
Load time monitoring. Collibra monitors how long data pipelines take to run and flags unusual load times. This isn't applicable to Sohovi's browser-based architecture.
Where Sohovi Has the Advantage
Privacy. Sohovi processes data entirely in your browser using Web Workers. Raw data never touches a server. Collibra necessarily requires your data to be accessible to their infrastructure.
Price. Collibra's enterprise pricing starts in the tens of thousands annually. Sohovi is designed for small businesses.
Setup. Sohovi requires zero infrastructure. Upload a CSV and you're profiling in seconds. Collibra requires connecting to data sources, configuring connectors, and a significant onboarding process.
Simplicity. The behavioral scoring in Sohovi is automatic — no configuration required. After 2+ completed runs, it just works.
Who Should Use Which
Use Collibra if: You're a large enterprise with data warehouse infrastructure, a dedicated data engineering team, and a budget for enterprise tooling. You need governance features beyond data quality.
Use Sohovi if: You're a small business, startup, or freelancer working with CSV/Excel data from CRMs, ERPs, or other exports. You want professional-grade data quality without enterprise complexity or pricing.
Key Takeaways
- Both systems use z-score-based statistical comparison against historical baselines
- The core algorithm is the same; the target audience and infrastructure are very different
- Collibra wins on scale, enterprise integrations, and governance breadth
- Sohovi wins on privacy, simplicity, speed of setup, and price
- For small businesses working with exported files, Sohovi provides Collibra-grade behavioral scoring for a fraction of the cost
FAQ
Q: Is Sohovi a direct Collibra replacement? A: For small businesses and individual analysts working with file-based data, yes. For enterprise data warehouse monitoring and governance, no.
Q: Does Sohovi connect to databases like Collibra does? A: Sohovi connects to Google Sheets, Airtable, REST APIs, and Cloud Storage in addition to CSV/Excel. It doesn't connect directly to SQL databases.
Q: How does Sohovi's privacy model compare to Collibra's? A: Sohovi processes data in your browser — raw row data never leaves your machine. Collibra requires your data to be accessible to their platform.
Q: Are the z-score thresholds the same? A: Collibra's thresholds are configurable within their platform. Sohovi uses a default threshold of 3 sigma, flagging at 3+ standard deviations from the historical mean.
Q: Does Sohovi store historical run data? A: Yes — Sohovi stores aggregated statistics (null rates, cardinality, averages) per column per run in Supabase. Raw data is never stored.
Q: What's the minimum number of runs needed for behavioral scoring? A: Both systems require a minimum of 2–3 historical runs to establish a meaningful baseline.
Q: Can Sohovi's behavioral scoring be turned off? A: It runs automatically after each run with no opt-in required. Individual flags can be acknowledged but the scoring itself is always on.
Q: Does Sohovi have a business glossary like Collibra? A: No. Sohovi is focused on data quality. It doesn't include data catalog, lineage, or business glossary features.
Q: Is Sohovi's AI rule builder comparable to Collibra's GenAI features? A: Both allow plain-English rule creation. Collibra uses GenAI to generate SQL; Sohovi uses local pattern matching to generate structured rule configurations — no API key or external service required.
Q: How does Sohovi handle schema drift compared to Collibra? A: Both detect column additions and removals. Sohovi surfaces schema drift in an amber banner on the run detail page automatically on every upload.