The Scaling Problem
At 5 clients, your analyst manually pulls data from Google Ads, Meta, and Google Analytics, formats it in a PowerPoint template, and sends it monthly. Quality is high because the same person does everything and knows the accounts well.
At 15 clients, you have 3 analysts. Each has their own way of pulling data. Each has their own interpretation of the template. Each client report looks slightly different. QA is a scramble before every send date.
At 30 clients, the system has broken down completely.
The Four Components of a Scalable Reporting System
1. A Data Layer
All client data should be centralized in one place before anyone builds a report. Options:
- A data warehouse (BigQuery, Snowflake) for high-volume agencies
- A BI connector tool (Supermetrics, Funnel.io, Power My Analytics) that pulls from all ad platforms into Google Sheets or Looker Studio
- A dedicated agency reporting tool (AgencyAnalytics, Databox, DashThis)
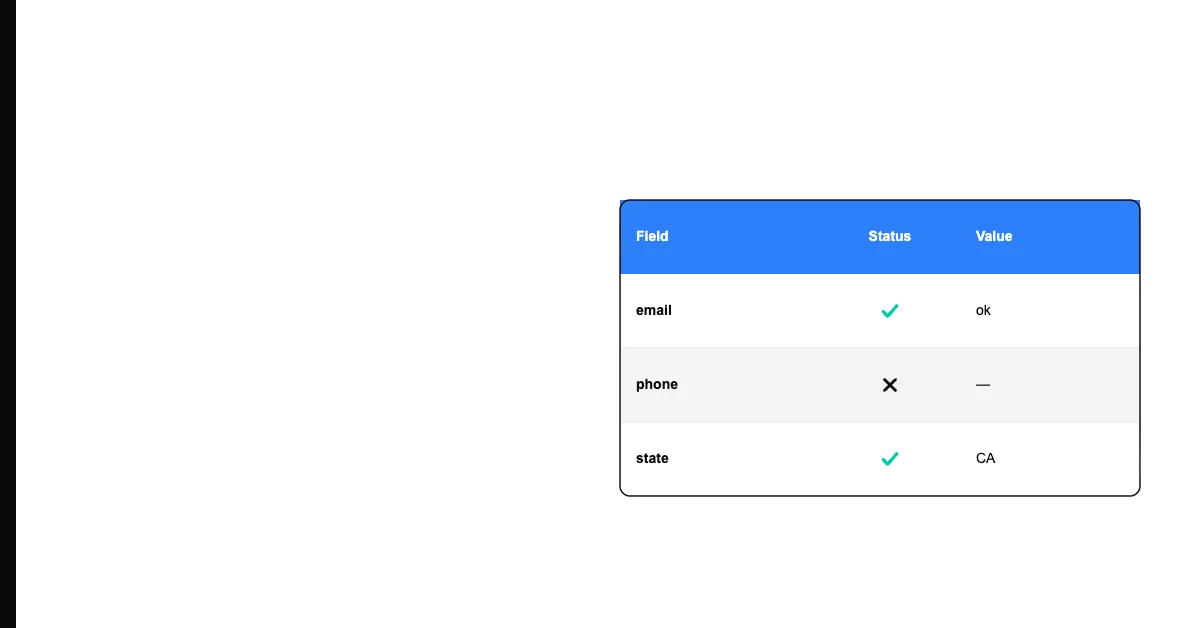
Sohovi validates your dataset before it enters the warehouse — catching format errors, nulls, and duplicates at the source.
The goal: analysts pull from one place with consistent settings, not directly from 5 different ad platform UIs.
2. A Template Layer
One report template per client tier (e.g., starter, growth, enterprise). Not one template per client — that's how you end up with 30 different formats.
The template defines: which metrics appear, in what order, with what YoY/MoM comparison, and with what visualization. Templates should be locked — analysts fill in data, not format.
3. A QA Layer
Before any report is sent:
- One person (not the report creator) checks figures against source data
- A QA checklist is completed and signed off
- Any anomaly (metric dramatically different from prior period) is explained in the report, not left to the client to discover
Sohovi tracks quality trends across runs and alerts you when a metric — null rate, duplicate count, score — moves outside its normal range.
4. A Delivery Layer
Reports should go out consistently — same date, same format, same delivery method. Inconsistency in delivery (sometimes on the 1st, sometimes on the 5th, sometimes PDF, sometimes Google Slides link) signals operational immaturity.
Starting Small
You don't need a data warehouse to start. For agencies under 20 clients:
- Standardize on one pull method per channel (e.g., Supermetrics pulling into a master Google Sheet)
- Create one template per service tier
- Implement a mandatory peer review before send
These three changes eliminate 80% of reporting quality problems without requiring new tools or significant investment.