You want to know: "Is our data good?" A data quality score gives you a single number to answer that question — one that can be tracked over time, compared across datasets, and used to prioritize improvement efforts.
A data quality score is an aggregate measure of how well a dataset performs across the key quality dimensions: completeness, accuracy, validity, uniqueness, consistency, and timeliness. Most scoring approaches produce a percentage from 0 to 100, where 100 represents data that fully meets all defined quality criteria.
How Data Quality Scores Are Calculated
There's no single universal formula — different tools and frameworks weight dimensions differently. But the most common approach is:
1. Score each dimension individually
- Completeness score: percentage of required fields that have values
- Validity score: percentage of values that pass defined format/rule checks
- Uniqueness score: percentage of records that have no exact duplicate
- (And so on for each applicable dimension)
Sohovi automatically finds every duplicate in your dataset — including near-matches — and shows you exactly which rows are affected.
2. Weight the dimensions by importance Not all dimensions matter equally for every use case. For a customer contact list, uniqueness and completeness of email are more important than precision. For financial records, accuracy and validity might be weighted highest.
3. Aggregate into a composite score Multiply each dimension score by its weight, sum the results. A dataset that's 95% complete, 90% valid, and 85% unique might produce a composite score of 90% if weighted equally — or a lower score if validity is weighted more heavily.
What Is a Good Data Quality Score?
Context matters, but as a general benchmark:
- 90–100%: Excellent. Suitable for high-stakes use cases like financial reporting or regulatory submissions.
- 75–89%: Good. Suitable for most business operations, but specific fields may need attention.
- 60–74%: Marginal. Significant issues exist that will cause visible problems in analysis and campaigns.
- Below 60%: Poor. Systematic problems require investigation and remediation before the data is reliably useful.
Industry estimates suggest the average enterprise database scores between 65–75% on composite quality measures (IBM, 2016). Most teams are surprised to find their score is lower than expected.
Using the Score Practically
A score is most valuable as a trend indicator. Is your data quality improving or declining over time? Which datasets are deteriorating fastest? Which teams or systems are introducing the most quality failures?
Sohovi tracks quality trends across runs and alerts you when a metric — null rate, duplicate count, score — moves outside its normal range.
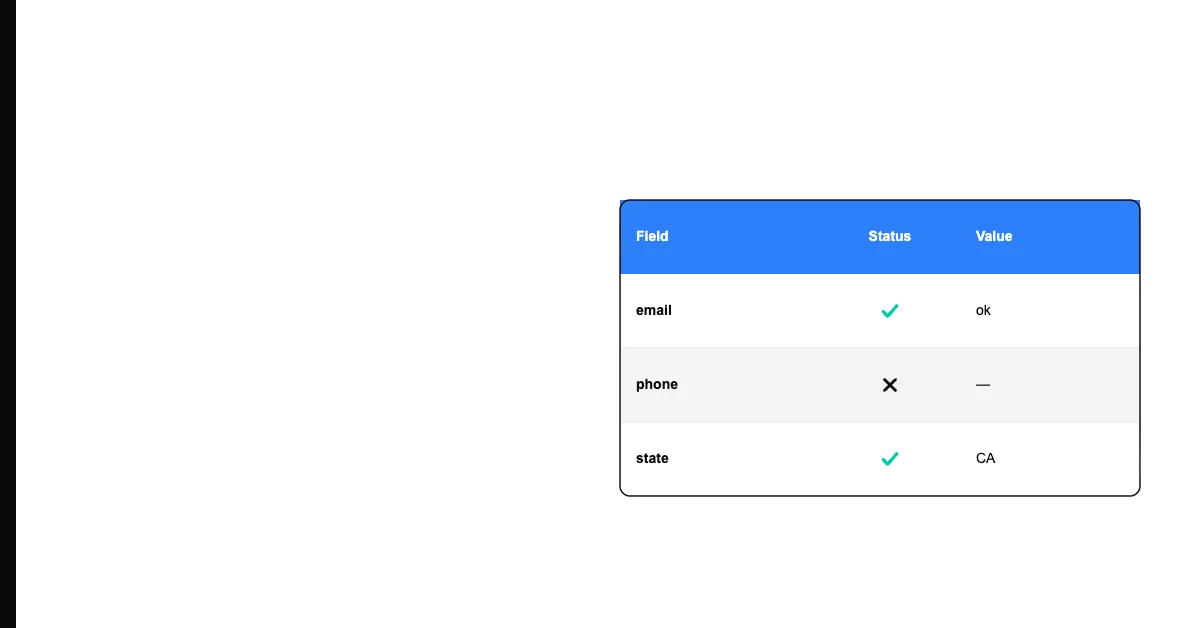
Sohovi calculates an instant data quality score for any CSV you upload — breaking it down by dimension and by column, so you can see both the overall health and the specific weak points.
A score without context is a vanity metric. A score that's tracked, understood, and acted on is a management tool.