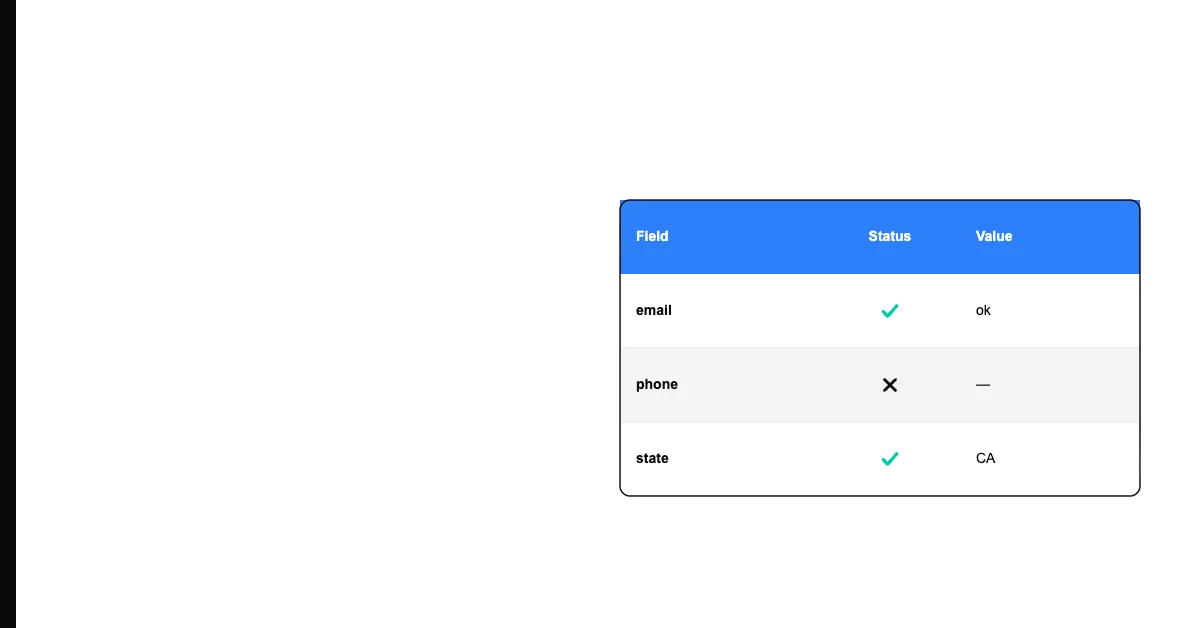
The short version: Data quality has 6 measurable dimensions — completeness, accuracy, consistency, validity, uniqueness, and timeliness. Each one answers a different question about your data. A dataset can score well on 5 dimensions and fail catastrophically on the 6th.
Here's the device that makes this concrete: one 15-row customer dataset that fails on all six dimensions simultaneously. Every section below points to the specific cells where each dimension breaks.
The Sample Dataset (Every Problem in One Table)
| # | Customer ID | Name | Email | Phone | Country | Revenue | Last Order | |---|------------|------|-------|-------|---------|---------|-----------| | 1 | 1001 | Sarah Chen | sarah@acme.com | +14155551234 | US | 4500 | 2026-01-15 | | 2 | 1002 | james park | james@acme | 4155551235 | USA | 4200 | 15/01/2026 | | 3 | 1003 | | admin@acme.com | +14155551236 | United States | 0 | 2026-01-16 | | 4 | 1004 | Sarah Chen | sarah@acme.com | +14155551234 | US | 4500 | 2026-01-15 | | 5 | 1005 | DAVID KUMAR | david@acme.com | +14155551237 | US | -200 | 2099-03-01 | | 6 | 1006 | Maria G | | +14155551238 | US | 3100 | 2026-01-18 | | 7 | 1007 | Chen, Sarah | sarah@acme.com | +14155551234 | US | 4500 | 2026-01-15 |
(Full 15-row dataset available for download — link in the CTA below)
Dimension 1: Completeness
The question it answers: Is all the data that should be there, actually there?
The metric: Percentage of required fields populated across all records.
Sohovi profiles your datasets for quality issues in minutes — see what's broken before it breaks your pipeline — try Sohovi free.
In the sample dataset: Row 3 has no Name. Row 6 has no Email. These are required fields in a customer contact dataset — a record without a name or email is functionally incomplete for most use cases.
How to measure:
- Per column:
=1 - COUNTBLANK(column)/COUNTA(column)→ gives completeness rate - Per row:
=COUNTA(A2:H2)/8→ fraction of fields populated in that row
How to fix: Decide for each missing value: delete the row, fill with a default, derive from other data, or flag as unknown. See: Handling Missing Values Without Python.
Sohovi profiles every column in your dataset for completeness and flags the exact rows where values are missing — free to try.
Target: 98–100% on required fields. For optional fields, below 20% null rate is typically acceptable depending on the field.
Linked deep-dive: What Is Data Completeness
Dimension 2: Accuracy
The question it answers: Do the values correctly reflect the real world?
The metric: Percentage of records with no known factual errors.
In the sample dataset: Row 5 has Revenue = -200. A negative revenue value for a customer is factually wrong for most business contexts — it's likely a data entry error (someone typed -200 instead of $200, or a refund was miscoded). Row 5 also has Last Order = 2099-03-01 — a future date 73 years from now is impossible and almost certainly a typo (2026 typed as 2099).
How to measure: Accuracy is the hardest dimension to measure automatically because it requires knowing the truth. Methods:
- Range checks:
=IF(OR(revenue < 0, last_order > TODAY()), "FLAG", "OK")— catches impossible values - Source comparison: Compare a sample of records against the authoritative source (the actual invoice, the actual customer)
- Outlier detection: Values far outside the expected range are candidates for accuracy review
Sohovi scores your dataset against your own accuracy standards and highlights the columns and rows where values fall outside expected ranges.
How to fix: Correct confirmed errors from source; flag uncertain outliers for human review. Never auto-correct — see: Should You Let AI Clean Your Data?.
Linked deep-dive: What Is Data Accuracy
Dimension 3: Consistency
The question it answers: Does the same entity look the same every time it appears?
The metric: Number of representations per entity; format uniformity across the column.
In the sample dataset: The Country column has "US", "USA", and "United States" — three representations of the same country. The Phone column has "+14155551234" (E.164) in row 1 but "4155551235" (no country code) in row 2. These inconsistencies break lookups, deduplication, and country-based segmentation.
How to measure: Pivot table on each categorical column to see all unique values. For format consistency: a formula like =LEN(SUBSTITUTE(A2,"+","")) on phone numbers reveals which ones have different lengths.
How to fix: Standardize to a canonical value. For countries: map all variants ("US", "USA", "United States", "U.S.A.") to the ISO 3166-1 alpha-2 code ("US"). For phones: standardize to E.164. See: How to Standardize Phone Numbers.
Linked deep-dive: What Is Data Consistency
Dimension 4: Validity
The question it answers: Do values conform to the defined format and business rules?
The metric: Percentage of records that pass all defined validation rules.
In the sample dataset:
- Row 2: email "james@acme" is missing the TLD (.com, .io, etc.) — invalid email format
- Row 2: Last Order "15/01/2026" is in DD/MM/YYYY format, inconsistent with the ISO 8601 format used by other rows — a format validity failure
- Row 5: Last Order "2099-03-01" is technically a valid date format but fails the business rule "last order date must not be in the future"
How to measure: Define explicit rules per column, then test against them:
- Email:
=ISNUMBER(FIND("@",B2)) * ISNUMBER(FIND(".",B2,FIND("@",B2)))— basic validity check - Date range:
=AND(G2 >= DATE(2020,1,1), G2 <= TODAY())— date within acceptable range - Country code:
=MATCH(D2, valid_countries_list, 0)— against a reference list
How to fix: Invalid values need human review — either correct them or exclude them. Don't silently pass invalid values into analysis.
Linked deep-dive: What Is Data Validity
Dimension 5: Uniqueness
The question it answers: Is each real-world entity represented exactly once?
The metric: Duplicate rate — percentage of rows that are duplicates of another row.
In the sample dataset: Rows 1, 4, and 7 are all "Sarah Chen" — three records for the same customer with the same email and phone. Row 4 is an exact duplicate of Row 1. Row 7 is the same person with the name in "Last, First" format — a fuzzy duplicate.
Duplicates inflate customer counts, cause duplicate outreach, and split purchase history across multiple records.
How to measure: On the email column: =COUNTIF(B:B, B2) > 1 — returns TRUE for duplicate emails. For fuzzy duplicates, requires fuzzy matching. See: Fuzzy Matching Explained.
How to fix: Exact deduplication first (Excel's Remove Duplicates or the free duplicate remover), then fuzzy dedup for name variants.
Linked deep-dive: What Is Data Uniqueness
Dimension 6: Timeliness
The question it answers: Is the data current enough for its intended use?
The metric: Age of records relative to how frequently the underlying reality changes.
In the sample dataset: This dimension isn't visible in a static snapshot — it requires knowing when the data was last updated relative to when it's being used. But the "Last Order" column of "2099-03-01" in Row 5 points to a related issue: data that appears to be timestamped in the future is a sign of poor timestamp discipline generally.
A customer database that was last cleaned 18 months ago has likely decayed significantly: 22–30% of business contact details change per year (people change jobs, email addresses, phone numbers). What was accurate 18 months ago may now have a 30% error rate.
How to measure:
- Check
last_updatedtimestamps across all records - Calculate the median age of records:
=TODAY() - MEDIAN(timestamp_column) - For contact data: email validation services can test whether addresses are currently deliverable (proxy for staleness)
How to fix: For contact data — enrich from updated sources, validate deliverability, remove contacts who haven't engaged in 12+ months. See: What Is Data Timeliness.
Linked deep-dive: What Is Data Timeliness
Summary Table
| Dimension | Question it answers | Quick metric | Sample dataset failures | |-----------|-------------------|-------------|------------------------| | Completeness | Is required data present? | % fields non-null | Row 3 (no name), Row 6 (no email) | | Accuracy | Is data factually correct? | % records with no known errors | Row 5 (negative revenue, future date) | | Consistency | Does the same entity look the same everywhere? | # of representations per entity | Country variants (US/USA/United States); phone format | | Validity | Do values match expected format and rules? | % records passing all validation rules | Row 2 (invalid email, wrong date format) | | Uniqueness | Is each entity represented only once? | Duplicate rate % | Rows 1, 4, 7 (same customer) | | Timeliness | Is data current enough for use? | Median record age vs. decay rate | Entire dataset (needs timestamp audit) |
Download the Messy Sample File
Download the full 15-row messy customer dataset and fix all 6 problems yourself. Sohovi will score each dimension as you clean the file — showing before/after metrics per dimension.
[Download link: /sample-data/messy-customer-dataset.csv — available on the Sohovi tools page]
Frequently Asked Questions
Q: Are there more than 6 data quality dimensions? Different frameworks use different numbers — DAMA's Data Management Body of Knowledge lists 10+ dimensions; ISO 25012 uses 15. The 6 covered here (completeness, accuracy, consistency, validity, uniqueness, timeliness) are the most practically measurable and the ones that affect business operations most directly. Additional dimensions like "credibility," "accessibility," and "portability" are real but less actionable for day-to-day data management.
Q: Which dimension matters most? It depends on the use case. For email campaigns: completeness and validity (invalid emails bounce). For CRM reporting: accuracy and uniqueness (wrong values and duplicates inflate counts). For AI training data: accuracy and consistency dominate. Run the audit in the template to see which dimension is lowest for your specific dataset.
Q: Can a dataset score well on all 6 dimensions and still be wrong? Yes — a dataset can be complete, accurate, consistent, valid, unique, and current, but still be the wrong dataset for the question you're asking. Data quality describes the intrinsic properties of the data, not whether it's the right data for a specific analytical purpose. That's a different problem (data fitness for purpose or relevance) that goes beyond the 6 dimensions.
Download the messy sample file and fix all six problems yourself — Sohovi scores each dimension as you go. Try it free, nothing to install.