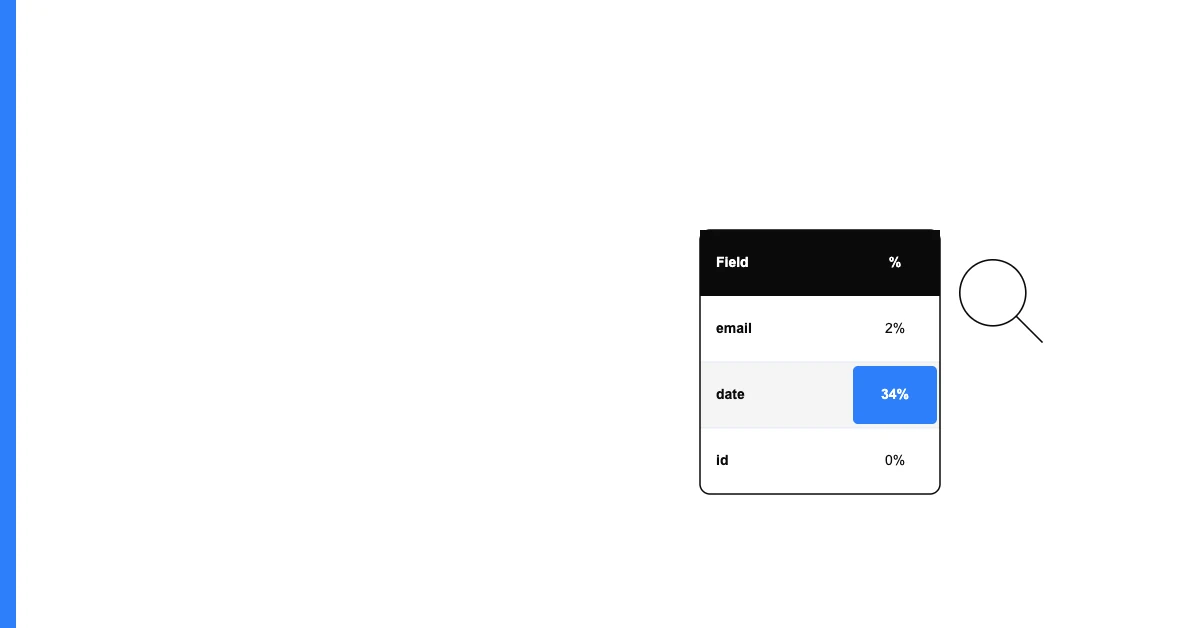
When you profile a dataset, you're really profiling it column by column. Each column in your spreadsheet or database table has its own characteristics — its own completeness rate, its own format patterns, its own distribution of values. Column profiling examines each field individually so you know exactly which columns are reliable and which ones need attention.
What Column Profiling Measures
For each column in your dataset, a full profile captures:
Data type — Is the column storing text, numbers, dates, or a mix? A column with mixed types (some numeric, some text) indicates data entry inconsistency.
Completeness — What percentage of rows have a non-null value in this column? The completeness rate tells you whether the column can be relied on for filtering or analysis.
Sohovi profiles every column in your dataset for completeness and flags the exact rows where values are missing — free to try.
Distinct value count — How many unique values does the column contain? A "country" column should have maybe 50 distinct values. If it has 500, you have a formatting or entry problem.
Most frequent values — What are the top 10 most common values? This quickly reveals unexpected patterns — like a "job title" column where the most common value is "N/A".
Min/Max values — For numeric and date columns, the range reveals outliers and potential errors. An order date of "01/01/1900" in a live dataset is almost certainly a data entry error.
Format patterns — For text columns, what patterns do the values follow? Are phone numbers consistently formatted? Do emails all match standard email format?
Why Column-Level Analysis Matters
Dataset-level summaries hide problems. A dataset that's "90% complete" overall might have one critical column (like email address) that's only 60% complete. Column profiling surfaces these field-level issues that aggregate metrics obscure.
Example: Profiling a Customer Contact List
Consider a 10,000-row customer list. Dataset-level analysis says: "97% complete." Column-level analysis reveals:
- email: 61% complete
- phone: 44% complete
- company: 88% complete
- last_name: 99% complete
- first_name: 98% complete
The dataset looks mostly fine overall. But the columns you'd actually use for outreach (email, phone) are severely incomplete. Column profiling is what surfaces that gap.
Running Column Profiling Without Code
Sohovi profiles every column in your uploaded CSV automatically — showing completeness rate, distinct value count, top values, data type consistency, and format patterns for each column in a single pass.
No SQL. No Python. No setup. Upload the file and see the column-level breakdown immediately.
For each column, you'll know immediately: is this field reliable enough to use?